As we see in Table 1 , during the past three decades the rate of growth of real GDP in Quebec has generally been below that of the rest of Canada and the United States.
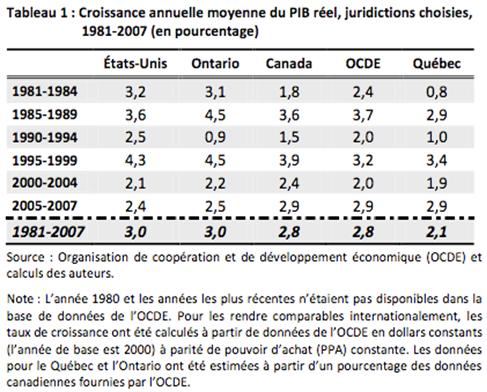
The recession of the early 1990s was more severe in Quebec and Ontario than in Canada and in the United States. Quebec’s low compound annual growth rate for the period 1990–1994 (1%) attests to both a deeper recession and a slower recovery in Quebec than in its neighbours.
With annual GDP growth of 2.1% from 1981 to 2007, real GDP growth in Quebec has also lagged behind the average growth of the OECD countries, the United States, Canada, and Ontario.
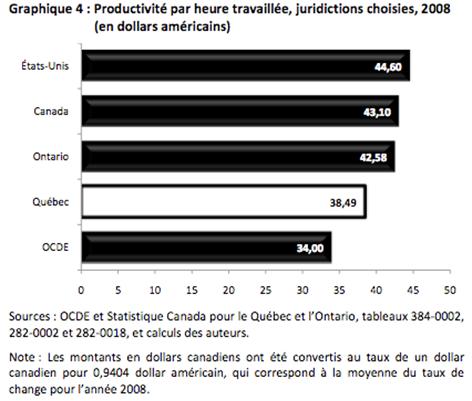
In 2008, productivity in Quebec generally remained below that of its main partners, as we see in Figure 4. Thus, measured in U.S. dollars, productivity is $42.58 per hour worked in Ontario, $43.10 in Canada and $44.60 for the United States. The corresponding value is $38.49 in Quebec, compared with $34.00 for all of the OECD Member States.
Historically, the unemployment rate has been higher in Quebec than in Ontario and Canada, as we see in Figure 11. The gap between the unemployment rates of Quebec and Ontario was particularly pronounced during the 1980s, when the rate was approximately four percentage points higher in the former than the in latter. This gap has vanished in the meantime, however, following a continuous period of decrease starting at the end of 1999. For the first time since 1976, this gap even became negative in January of 2009 when Quebec’s unemployment rate fell below that of Ontario, though this does not appear in the annualized data of Figure 11.
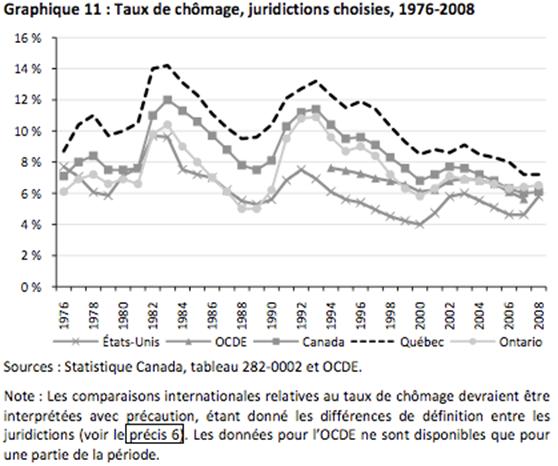
Quebec’s unemployment rate is also higher than that of other reference jurisdictions. While the difference with the Canadian unemployment rate has remained relatively stable over time, fluctuating between 1.5 and 2.5 percentage points, it has tended to shrink relative to those of the United States and the OECD Member States. The gap with the United States began to close during the recovery that followed the recession of the early 1990s. Starting in 1996, the gap between the Quebec and U.S. unemployment rates has declined steadily, dropping from 6.5 percentage points in 1996 to 1.4 in 2008.
In comparison to the reference jurisdictions, Quebec had relatively fewer individuals aged 25 to 44 who held a university degree in 2006, as we see in Figure 14 . In Quebec, 26.5% of the population was university educated, versus 27.5% in Canada and 30.9% in Ontario. This percentage was 35.5% in the United States and 37.3% in the OECD Member States. Thus, Quebec had almost 30% fewer individuals with a university degree than the OECD average, 25% fewer than its neighbour to the south, and 15% fewer than Ontario.
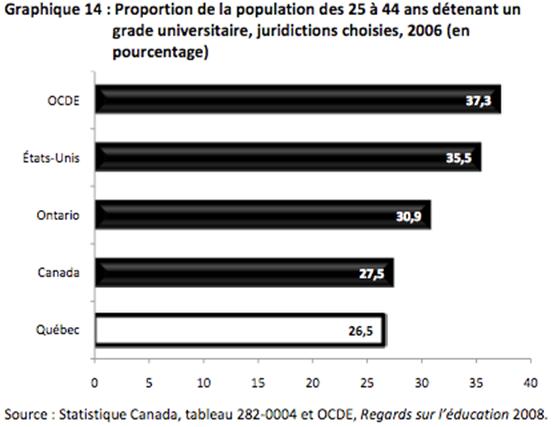
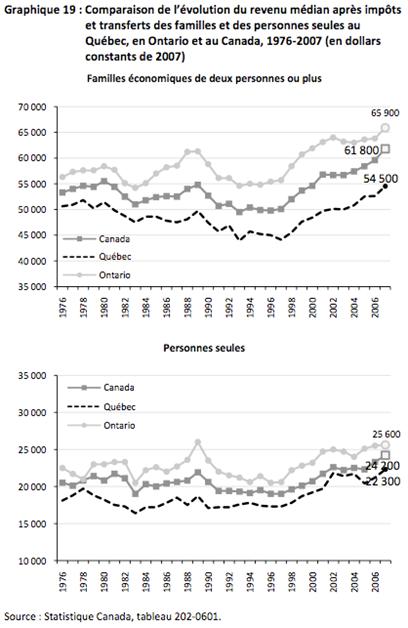
Figure 19 illustrates that, since 1976, median incomes after taxes and transfers, for both individuals and families, are lower in Quebec than those observed in Canada as a whole and in Ontario.
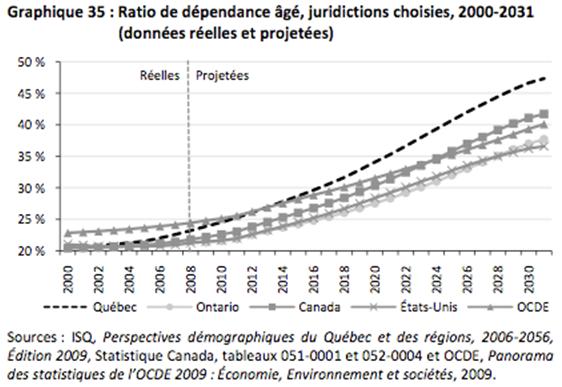
The conjunction of rising numbers of persons aged 65 years and over and declining numbers of those aged 20 to 64 is causing a rapid rise in the old-age dependency ratio. Figure 35 illustrates that, while this ratio in Quebec was virtually equal to, or below, its value elsewhere in 2000, it has increased more rapidly here to become the highest in 2031.
5. Expanding gaps between demographic growth and economic dynamism in metropolitan centres and rural regions 
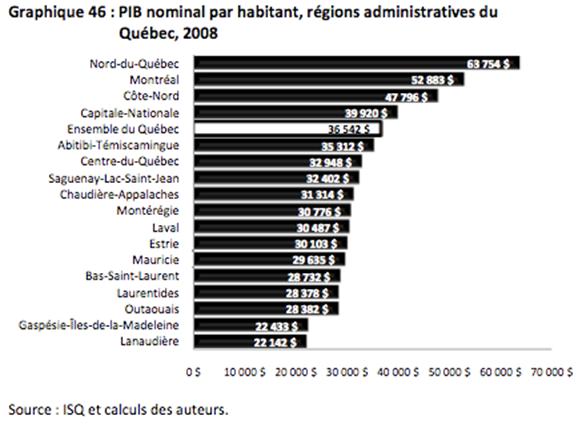
As Figure 46 shows, nominal GDP per capita was highly variable across the regions of Quebec. Nearly $64 000 in Nord-du-Québec, it was only $22 000 in Lanaudière and Gaspésie. Per capita GDP in Quebec as a whole was $36 500 in 2008. Only four regions exceeded this value: Nord-du-Québec, Montreal, Côte-Nord, and Capitale-Nationale.
Long-term demographic forecasts for the regions of Quebec reveal that the regions bordering the metropolitan regions will experience marked growth until 2031. From just under four million residents in 2006, they are expected to reach nearly five million in 2031. This implies 23% growth over 2006, or an average of 1% annually. As we see in Figure 49 , metropolitan regions will also experience an increase in population, from 2.5 million residents in 2006 to 2.8 million in 2031. This represents a total increase of 12% over 25 years, or an average of 0.5% annually. Overall, population growth in the urban centres will be half as rapid as in the adjacent regions. Peripheral regions will barely hold on to their population of approximately 1.1 million residents over the next 20 years.

Figure 51 puts the evolution of Quebec’s tax rate burden into context with that of the average of the OECD Member States, Canada, Ontario, and the United States. The Quebec rate stands out for its more pronounced increase. We observe a net growth in Quebec’s tax rate burden between 1985 and 2006, rising from 34.6% to 39.5 % of GDP. Until the mid-1980s, the tax rate burden in Quebec was comparable to that of the OECD, but the gap has grown since then.
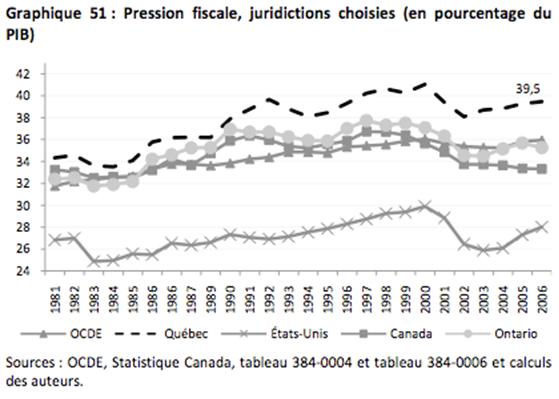
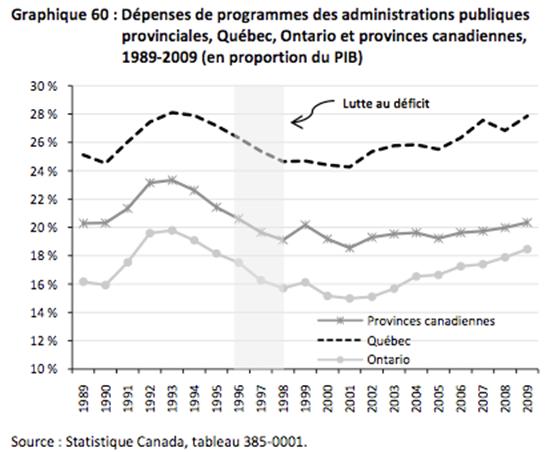
Figure 60 also reveals that program spending in Quebec has fluctuated between 24% and 28% of GDP in the past 20 years. Between its high in 1993 and low in 2001, we find the period of fiscal restraint that followed the socio-economic summit of 1996 and led to the zero deficit of 1998—the impact of which is clearly seen. Finally, in recent years the expenditures of the government of Quebec have risen more rapidly than economic growth—a phenomenon we also observe in the other provinces, though to a lesser extent. In Quebec, Ontario, and the interprovincial average, government spending has risen constantly since 1989 when measured in constant dollars per capita, except during the years of fiscal restraint between 1996 to 1998. In 1998, following most of the cutbacks, the provinces of Canada had collectively reduced their per capita expenditures to 1991 levels. This was also the case in Ontario, though Quebec had brought per capita program spending back to its 1992 level.
It is possible to make inter-jurisdictional comparisons in order to situate Quebec’s debt relative to those of other provinces and countries. In Figure 73 , Quebec and Ontario are juxtaposed with Canada, the United States, and the average for the OECD on the basis of these calculations. Box 13 presents detailed interprovincial comparisons.
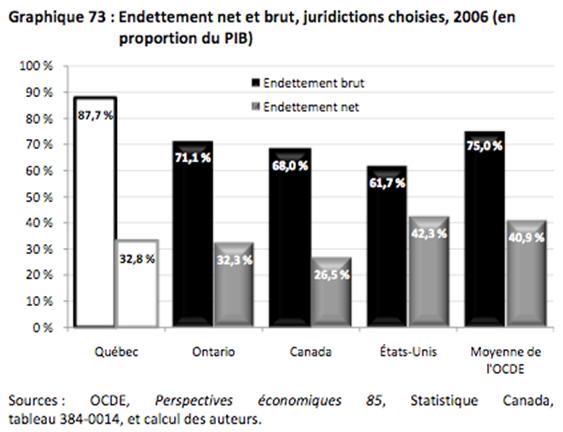
In this comparison the situation of Quebec appears paradoxical. On one hand, Quebec is seen to have a modest level of net indebtedness. Compared to the United States and the OECE average, Quebec’s net debt level is decidedly lower, by an amount on the order of 10 percentage points of GDP.
On the other hand, the picture is radically different when we look at gross indebtedness. Clearly, Quebec bears the greatest gross debt load as a proportion of GDP. Thus, Quebec has a heavy gross debt load but substantial financial assets.